To help achieve another stage of ‘Deep Work’ and to find more time to focus more on my studies, this week I vowed to not use Facebook and Instagram for five days. In his book Deep Work, Cal Newport, stresses the importance of connecting with your work to find meaning in it. He describes the concept of ‘flow’ as being when a person concentrates very deeply and are completely immersed in their work. This has been shown to give people greater enjoyment in life. “To build your working life around the experience of flow produced by deep work is a proven path to deep satisfaction.” With sheer willpower to not open the Facebook and Instagram apps for five days, I was on my way to find my flow and pleasure in my work.
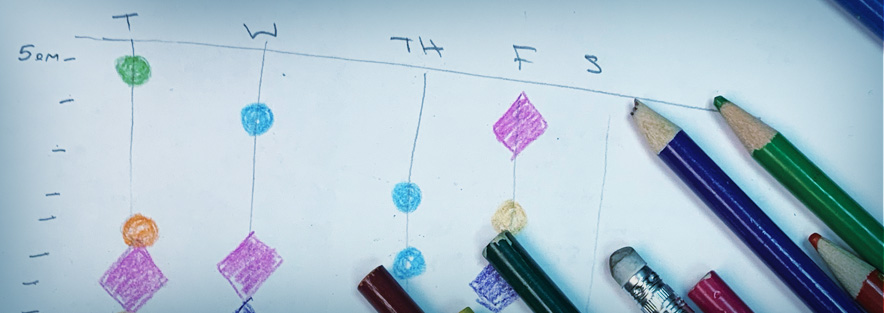
To make my social media detox experience more interesting, I recorded every instance I wanted to open the apps, the time of day, what I did instead and for how long. I was looking to find how much time I was really spending on these apps and how I could possibly fill my time instead. Inspired by the beautiful postcards created by Giorgia Lupi and Stefanie Posavec, I decided I would present my findings in a colorful whimsical way similar to their project Dear Data. The way Lupi and Posavec drew their datasets was so captivating I found myself immersed in every shape, color and line they chose to represent what they were measuring. With less screen time, I was excited to create a visually appealing dataset.
Some interesting patterns emerged from five days of research. When looking at the visual representation of my social media urges below, it became obvious I craved the apps more in the afternoon when fatigue crept in. During those times, I took more frequent and longer breaks. One habit I was unhappy to find was my desire to check Facebook when I woke up and before I went to bed. Analyzing this now, I can understand my time would be better spent getting more rest. It was interesting to see the variety of things I occupied myself with such as reading more news, listening to podcasts and looking at pictures of my own kids! I may have gone a bit overboard with checking email; I may have to detox on that next.

One piece of information I was unable to visually represent were my feelings throughout this process. At the beginning of the experiment, I desperately wanted to check Facebook to see ‘first day of school’ pictures. Also, it was the first day with distance learning and I really wanted to see how parents were reacting to this change. I did anything I could to keep my finger from tapping the ‘F’ icon on my phone including going for a walk and texting a friend. The second day was just as hard because there was a Board of Ed meeting the night before and I wanted to know if anything important was mentioned. By the third day, I started to have less urges and started seeking out different ways to resist social media like reading the news. After my five days were up, I excitedly opened up my phone to see what I missed out on. Surprisingly, it wasn’t much. Aside from cute pictures of my nieces everything else was negative banter or ads. My fear of missing out was for nothing.
While using myself as a guinea pig, I read up on the effects of social media and learned a few key points about conducting research. After I read the article Have Smartphones Destroyed a Generation?, I felt I really needed to pay attention to my emotional state throughout my experiment. The article focuses on the negative effects social media has on teens’ mental health claiming it leads to anxiety, depression and sleep deprivation. The only change I found in myself was that without social media, I did sleep a little longer. Interestingly, this article was cited in the next piece I read, Social Media Has Not Destroyed a Generation. The theme focused on the effect of social media but the underlying message was about how flawed and subjective scientific studies were. This article stressed the importance of understanding your source. I learned how crucial it is to know who the author is, what motivations they have and their sources.
When it was time to pull my data together, I enjoyed sketching ideas, playing with color and brainstorming. Before I knew it, two hours had passed and I had created a visually appealing chart and that made me happy. I realized I had reached a state of flow just like Bill Burnett and Dave Evans describe in their book Designing Your Life: How to Build a Well-Lived Joyful Life. They define flow as “experiencing complete involvement in the activity and feeling a sense of ecstasy….” I was proud of my work, I had not designed in Adobe Illustrator in a long time and it was nice to play around in one of my favorite programs.
By removing myself from social media, I discovered it is just another form of entertainment and should be taken in small batches. Without distractions, I focused more on my work, got more sleep and eliminated a piece of shallow work as Cal Newport advises to do so. Without giving it up completely, I realize there is a place for it, I need to receive an announcement from school groups and I enjoy finding design inspiration on Instagram. One change I plan to make is to set limits for myself by using my phone’s settings. Above all else, this experiment taught me that I really enjoy collecting data about my behavior and I found I really enjoyed creating eye-catching data.


